Image Details
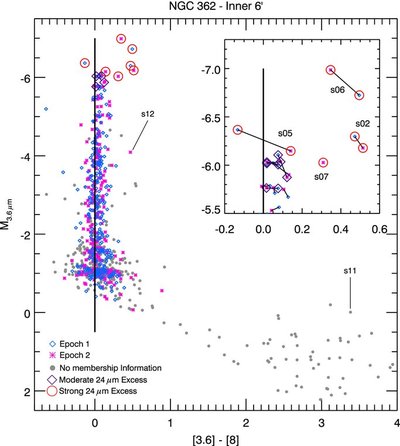
Caption: Figure 4.
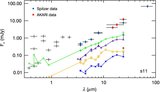
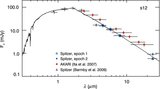
[3.6] vs. [3.6] − [8] color–magnitude diagram. Lines connect points from each IRAC epoch. The sources identified as candidate stars with strong and moderate mass loss in Figure 3 are marked by red circles and purple diamonds, respectively. The crowded region toward the TRGB is inset at the top right. The source at [8] − [24]>3.5 and M 24 μm < −7 mag in Figure 3 (source s11) is located far from mass-losing AGB stars and near unresolved background galaxies in this CMD. Source s12 may be a background SMC carbon star.
Other Images in This Article
Copyright and Terms & Conditions
© 2009. The American Astronomical Society. All rights reserved.
Copyright ©
2025 Astronomy Image Explorer. All Rights Reserved.