Image Details
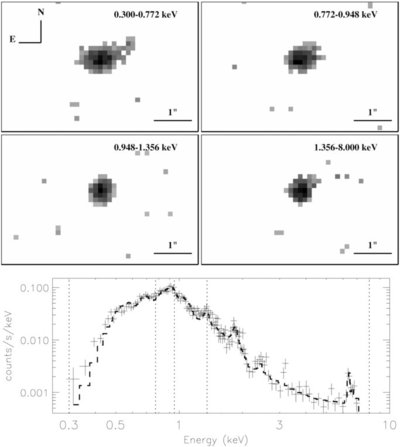
Caption: Figure 3.
Images (to which both SER and maximum likelihood deconvolution have been applied) in four energy bands containing roughly the same number of counts (1000). Lower panel: Chandra spectrum of RS Oph (and overlaid best-fit model) with dashed vertical lines indicating the four energy ranges used to generate the four images in the upper panels. The asymmetric X-ray feature is most pronounced in the soft band ( E < 0.77 keV).
Other Images in This Article
Copyright and Terms & Conditions
© 2009. The American Astronomical Society. All rights reserved.
Copyright ©
2025 Astronomy Image Explorer. All Rights Reserved.