Image Details

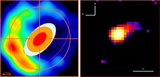
Caption: Figure 1.
Comparison of Chandra images of RS Oph with various levels of image processing. (a) Image obtained from pipeline products without further processing; (b) image created after applying SER (see the text) to the data; (c) resulting image after performing maximum likelihood deconvolution using a simulated PSF; (d) image created after applying both SER and maximum likelihood PSF deconvolution as described in Section 3.2. A comparison of panels (a) and (b) confirms that SER does not introduce any spurious asymmetry into the image. A comparison of panels (c) and (d) shows that the extended structure was clearly visible in the deconvolved image, even before the application of SER. The innermost contour encloses 4095, 3739, 4955, and 5140 counts in panels (a) through (d), respectively. Between the innermost and middle contours are 1252, 1589, 649, and 489 counts for panels (a) through (d), respectively. Between the middle and outermost contours are 299, 326, 66, and 64 counts for panels (a) through (d), respectively. North is up and east is to the left.
Other Images in This Article
Copyright and Terms & Conditions
© 2009. The American Astronomical Society. All rights reserved.