Image Details
Caption: Figure 2.
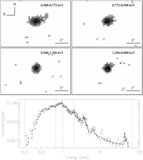
Profiles of the intensity along, and perpendicular to, the narrow X-ray feature. The solid curve shows the intensity profile
along the narrow feature while the dotted line shows the profile in the direction perpendicular to the feature. The length
of the extended feature, as measured from the centroid of the PSF to the location where the intensity falls below 10 counts
per 0
![]() 125 spatial bin (marked with a dot-dashed vertical line), is 1.2 ± 0.3 arcsec. Error bars represent 1 standard deviation.
The error in radial distance was estimated to be the best achievable SER pixel size, i.e., 0
125 spatial bin (marked with a dot-dashed vertical line), is 1.2 ± 0.3 arcsec. Error bars represent 1 standard deviation.
The error in radial distance was estimated to be the best achievable SER pixel size, i.e., 0
![]() 3.
3.
Other Images in This Article
Copyright and Terms & Conditions
© 2009. The American Astronomical Society. All rights reserved.