Image Details
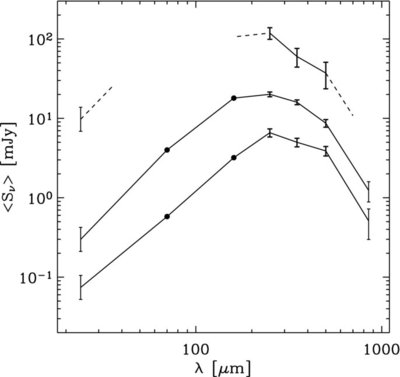
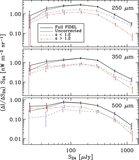
Caption: Figure 6.
Spectra of the mean flux density in BLAST bands of sources of fixed 24 μm flux density. The three curves correspond to the 24 μm flux densities indicated by the three vertical lines in Figure 5. The point at 24 μm on each curve is the central flux density of the bin defining each subsample and the error bar indicates the width of that flux density bin. The circles at 70 and 160 μm on the lower two curves are the mean flux densities in those bins determined by a similar stacking analysis in Dole et al. (2006, Figure 7). For the upper curve, 70, 160, and 850 μm flux densities are not available, so we plot dashed lines following the same slopes as the middle curve. A clear trend of increasing mean flux density and apparent temperature (spectrum peaking at shorter wavelengths) is observed in the BLAST bands with increasing 24 μm flux density.
Other Images in This Article
Copyright and Terms & Conditions
© 2009. The American Astronomical Society. All rights reserved.