Image Details
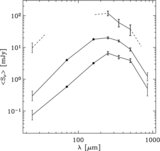
Caption: Figure 5.
Mean BLAST flux density of FIDEL sources is plotted against 24 μm flux density for each of the three BLAST bands. The 350 and 500 μm curves have been horizontally displaced by −5% and +5%, respectively, for visual clarity. The line near the uppermost curve is S BLAST ∝ S 1/2 24, shown for reference. The vertical lines indicate the MIPS flux densities for which mean spectra are plotted in Figure 6. The number of FIDEL 24 μm sources per bin decreases from ~ 2600 at the faint end to 3 at the bright end. The lowest flux density bins are based on tentative 24 μm detections, and are therefore biased low (see Section 4.5).
Other Images in This Article
Copyright and Terms & Conditions
© 2009. The American Astronomical Society. All rights reserved.