Image Details
Caption: Figure 2.
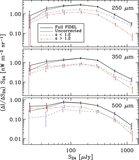
Quantification of errors in FIDEL stacking measurements. We calculate the average BLAST flux density at N random positions in the each map, where N is equal to the number of sources in the FIDEL catalog. Upper row: histograms of 10 5 stacking measurements at random positions. The scale on the y-axis is the number of simulations per 5 μJy bin. Lower row: difference between the histograms and the Gaussians centered at 0.0 with width equal to the rms of the distributions—clearly the histograms are very well described by Gaussians. We use the rms of these distributions as the errors in the stacked background values. We note that the errors between bands are strongly correlated, with Pearson correlation coefficients ρ ~ 0.7 (see Table 1) in all cases.
Other Images in This Article
Copyright and Terms & Conditions
© 2009. The American Astronomical Society. All rights reserved.