Image Details
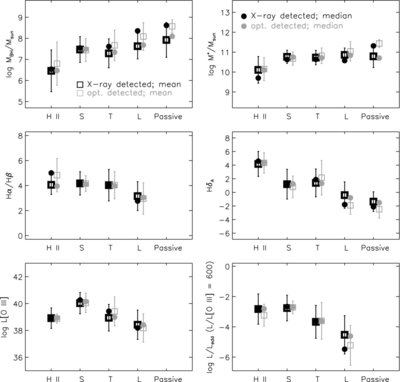
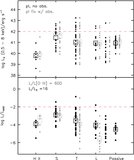
Caption: Figure 4.
Comparison of median and average optical properties of X-ray-detected galaxies and all optically selected galaxies on or near ChaMP fields/chips, along the H ii → S → T → L → passive galaxies sequence. The plots show: the BH mass (based on M BH–σ * relation of Tremaine et al. 2002), the (dust corrected) stellar mass (log M */ M ☉), the Balmer decrement, the Hδ A Balmer absorption-line index, L[O iii], and the accretion rate expressed by L bol/ L Edd, where L bol/ L[O iii] = 600; average and median values are indicated by squares and circles, respectively.
Other Images in This Article
Copyright and Terms & Conditions
© 2009. The American Astronomical Society. All rights reserved.