Image Details
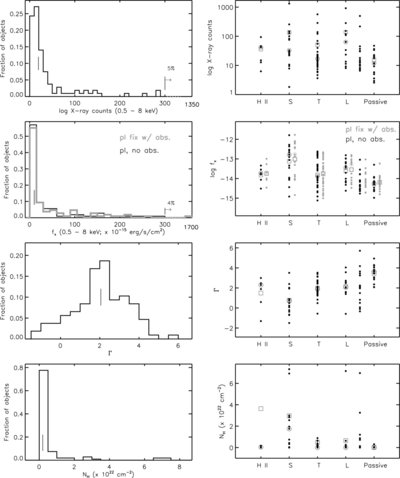
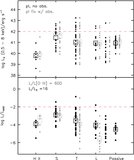
Caption: Figure 3.
Distribution of X-ray properties of the ChaMP galaxies. Left: histograms of X-ray counts in the 0.5–8 keV regime, the X-ray flux f x (calculated via two fitting models: a power law with no intrinsic absorption and a fixed power law with variable absorption), the (best) X-ray photon index Γ, and the (best) N H (see text); median values are indicated by the vertical bars. Right: individual measurements of X-ray counts, f x , Γ, and N H shown separately per galaxy spectral type; average and median values are indicated for all types of objects by squares and circles, respectively.
Other Images in This Article
Copyright and Terms & Conditions
© 2009. The American Astronomical Society. All rights reserved.