Image Details
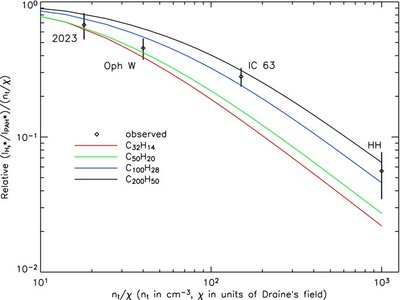
Caption: Figure 6.
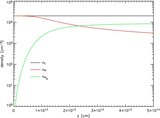
Comparison between observation and the prediction of the model. The general trend of the lowering of the ratio at higher values of n t /χ is well followed by the model. The Orion bar data have been used to scale the other observed data to produce relative values. The values for R are calculated in the fringe of the cloud as in Figure 2. The effect of dust extinction has not been included as discussed in Section 4.1. Error bars are from Habart et al. (2004), except for the Horsehead Nebula (Habart et al. 2005).
Other Images in This Article
Copyright and Terms & Conditions
© 2009. The American Astronomical Society. All rights reserved.
Copyright ©
2025 Astronomy Image Explorer. All Rights Reserved.