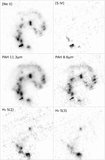
Image Details
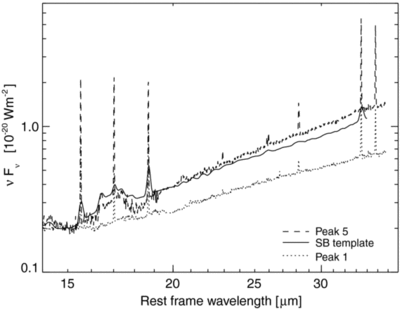
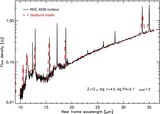
Caption: Figure 7.
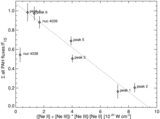
Comparison of the 14–37 μm continuum slopes for three selected objects: peaks 1 and 5 with the most shallow and steep slopes in our sample of Antennae clusters, and the average starburst template spectrum from Brandl et al. (2006). The spectra are plotted in units of ν F ν to enhance the differences, and have been normalized to unity at 15 μm.
Other Images in This Article
Show More
Copyright and Terms & Conditions
© 2009. The American Astronomical Society. All rights reserved.
Copyright ©
2026 Astronomy Image Explorer. All Rights Reserved.