Image Details
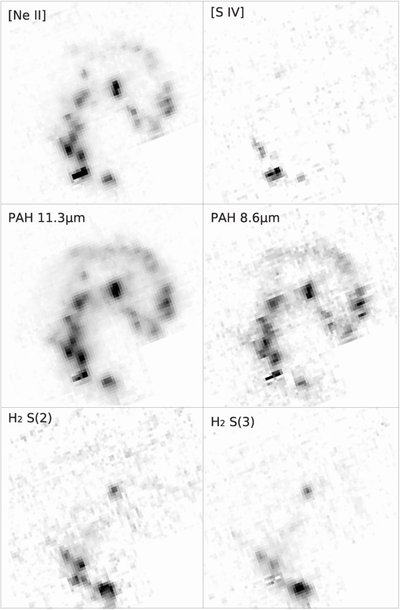
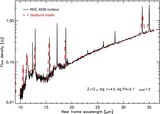
Caption: Figure 4.
IRS-SL spectral maps at the [Ne ii] and [S iv] lines (top), the 11.3 μm and 8.6 μm PAH features (center), and the S(2) and S(3) rotational lines of H 2. The spectral continuum has been subtracted and the images shown represent the pure line intensities. The maps are shown in linear scaling. North is up and east is left. The images are approximately 135'' (14.4 kpc) aside. For a discussion see Section 4.4.
Other Images in This Article
Show More
Copyright and Terms & Conditions
© 2009. The American Astronomical Society. All rights reserved.
Copyright ©
2026 Astronomy Image Explorer. All Rights Reserved.