Image Details
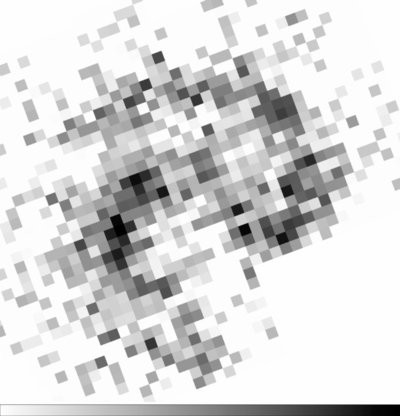
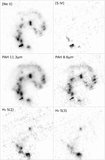
Caption: Figure 10.
IRS spectral map of the 8.6 μm/11.3 μm PAH ratio. The median ratio has been normalized to unity, which is colored in mean gray, and the range extends over a factor of 2 to both sides. Brighter regions represent relatively stronger 8.6 μm emission, darker regions weaker 8.6 μm emission. Field size and orientation are as in Figure 4 but the resolution has been reduced by rebinning by a factor of 2 to suppress the noise.
Other Images in This Article
Show More
Copyright and Terms & Conditions
© 2009. The American Astronomical Society. All rights reserved.
Copyright ©
2026 Astronomy Image Explorer. All Rights Reserved.