Image Details
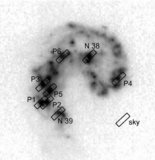
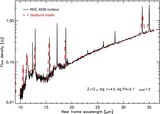
Caption: Figure 12.
Strength of the H 2 lines plotted vs. the strength of the PAH emission features. The figure contains two sets of data: the large diamonds correspond to the eight "hires" positions for which all PAH features longward of 10 μm have been added; the dots refer to pixels within our "lores" spectral maps for which the signal is at least 2.5σ. In the case of the "lores" data the PAH strength is the sum of the 8.6 μm and 11.3 μm maps and the H 2 strength has been derived from the S(2) and S(3) lines. The pixel fluxes have been scaled to match the "hires" data points.
Other Images in This Article
Show More
Copyright and Terms & Conditions
© 2009. The American Astronomical Society. All rights reserved.
Copyright ©
2026 Astronomy Image Explorer. All Rights Reserved.