Image Details
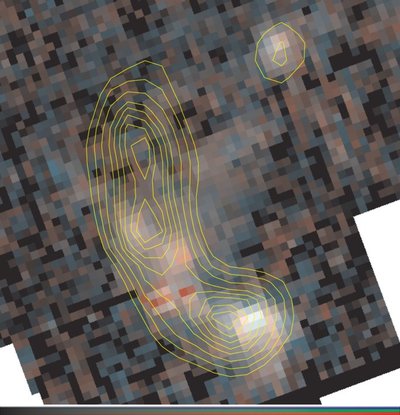
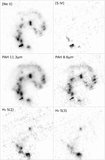
Caption: Figure 11.
False-color IRS spectral map of the H 2 S(3) line in the green and blue channel, and the S(2) line in the red channel in square-root scaling. Bluer colors mean warmer H 2. North is up. The two nuclei and the emission from the clusters in the overlap region are clearly visible. The yellow contour lines indicate the ISOCAM-CVF measurements of the H 2 S(3) line by Haas et al. (2005); the levels are at 39%, 49%, 58%, 68%, 78%, 84%, 90%, and 96% of the maximum intensity (see Figure 2 in Haas et al. 2005).
Other Images in This Article
Show More
Copyright and Terms & Conditions
© 2009. The American Astronomical Society. All rights reserved.
Copyright ©
2026 Astronomy Image Explorer. All Rights Reserved.