Image Details
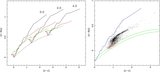
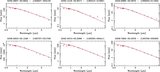
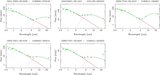
Caption: Figure 9.
Left-hand panel: distributions of observed and dereddened r′ and [8] magnitudes for the 2692 A-type stars. After dereddening, good agreement between the IPHAS and Spitzer photometry is found, in accord with most stars being A-types. Right-hand panel: histogram showing the distance distribution of the GLIPHAS sample, together with the IRAC 8 μm and MIPS 24 μm limiting distances for an unreddened A3V star. The dotted lines represent the limiting distances for detection of a 10 mJy and 1 mJy A3V star respectively, while the dashed line shows the 1 mJy MIPS limit. The limiting distances for unreddened A-type dwarfs in the IPHAS and 2MASS surveys fall well beyond the range of this plot (greater than 20 kpc and greater than 4 kpc, respectively).
Other Images in This Article

Copyright and Terms & Conditions
© 2009. The American Astronomical Society. All rights reserved.