Image Details
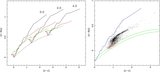
Caption: Figure 5.
Left-hand panel: distributions of E( K − 8) color excesses for 2692 A-type stars in the GLIPHAS sample. Right-hand panel: distributions of S/N for ( K − 8) color excesses.
Other Images in This Article

Copyright and Terms & Conditions
© 2009. The American Astronomical Society. All rights reserved.
Copyright ©
2025 Astronomy Image Explorer. All Rights Reserved.