Image Details
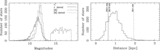
Caption: Figure 1.
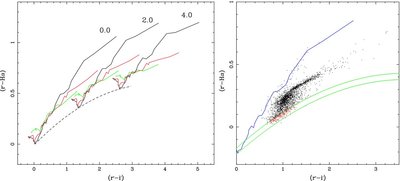
Left-hand panel: synthetic ( r′ − H α) vs. ( r′ − i′) colors of normal stars under the effect of interstellar extinction (adapted from Drew et al. 2005). For a given visual color excess E( B − V), the black lines represent the MS, the red lines represent the giant sequence and the green lines show the positions of the supergiants. The dashed line shows the reddening track for the normal metallicity A0V star from the Pickles (1998) library: it is a representative early-A reddening line. Right-hand panel: the ( r′ − H α) vs. ( r′ − i′) color plane for IPHAS field 4232. An early-A star strip, of width 0.05 mags in ( r′-H α) (green lines) was used to select for A-type dwarfs (red dots). The blue line corresponds to an unreddened MS track.
Other Images in This Article

Copyright and Terms & Conditions
© 2009. The American Astronomical Society. All rights reserved.