Image Details
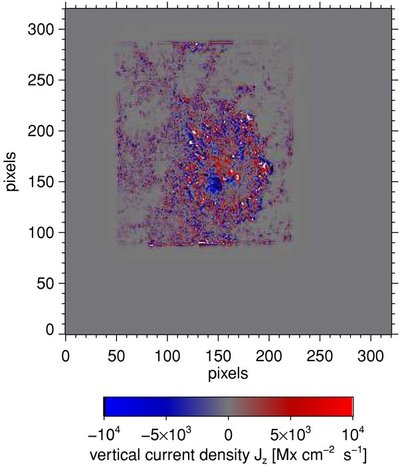
Caption: Figure 3.
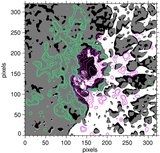
Map of the vertical component of the electric current density J z at the lower bounding surface as determined from Hinode/SOT–SP vector-field measurements (i.e., prior to preprocessing). The values of B x and B y , and therefore J z , outside of the region containing vector magnetogram data are unknown and have been zeroed out. Saturation of the color table is indicated by black or white hues. The pixel scale is 580 km per pixel.
Other Images in This Article
Copyright and Terms & Conditions
© 2009. The American Astronomical Society. All rights reserved.
Copyright ©
2025 Astronomy Image Explorer. All Rights Reserved.