Image Details
Caption: Figure 1.
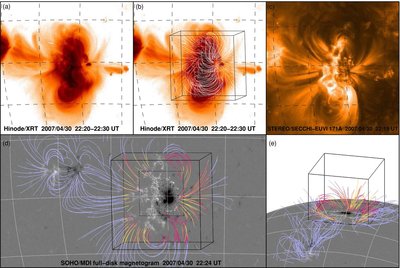
Series of co-aligned images of AR 10953 (with the same 10° gridlines drawn on all images for reference). ( a) Time-averaged and logarithmically scaled Hinode/XRT soft X-ray image, and ( b) with the best-fit Wh − model field lines overlaid. ( c) STEREO– A/SECCHI–EUVI 171 Å image. ( d) Trajectories of loops, as viewed from the perspective of an observer located along the Sun–Earth line of sight and determined stereoscopically from contemporaneous pairs of images from the two STEREO spacecraft. ( e) Same visualization as panel ( d) but viewed from the side. The solid black cubes in panels ( d) and ( e) outline the full 320 × 320 × 256 pixel NLFFF computational domain, and the interior dotted black square outlines the base of the smaller 160 × 160 × 160 pixel volume (covering most of the Hinode/SOT–SP scan area) used for the field line maps of Figure 2 and for the metrics in Table 1. The STEREO-loop points are colored blue if outside the NLFFF computational domain, or are colored according to their misalignment angle ϕ made with the field lines from the Wh − solution. Yellow is indicative of ϕ < 5°, red of ϕ>45°, with a continuous progression from yellow through orange to red for 5° < ϕ < 45°. On the bottom face of the large cube is displayed the B z map used during the NLFFF modeling, which includes higher resolution data from Hinode/SOT–SP embedded in SOHO/MDI full-disk magnetogram data. The magnetogram images saturate at ±1500 Mx cm −2.
Other Images in This Article
Copyright and Terms & Conditions
© 2009. The American Astronomical Society. All rights reserved.