Image Details
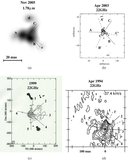
Caption: Figure 8.
Left: radial velocity distribution in the disk around U Ori (north top, east left). All available radial velocity measurements are marked with points in this figure. The best fit reflection-symmetric radial velocity pattern is shown, with grey for the average (−42 km s −1), white for receding (maximum with respect to average is +8 km s −1), and black for approaching (maximum with respect to average is −8 km s −1). The projections of the rotational axis, the polar outflow and some peculiar features Chapman et al. (1991) are also marked. Right: same as the left figure except for only data points used in the fitting procedure.
Other Images in This Article
Copyright and Terms & Conditions
© 2009. The American Astronomical Society. All rights reserved.