Image Details
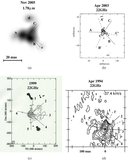
Caption: Figure 3.
Reconstructed images of U Ori at 1.51 μm, 1.64 μm, and 1.78 μm (top, from left to right). The contour maps of the brightness distribution are over plotted. The step between contours is equal to 7.06% with the lowest brightness level of 1.0% and the highest brightness level of ~93%. The corresponding images of the envelope, obtained by removing the model of the central source are shown in the second row. The estimated angular diameters of the star (17.2, 14.6, and 16.4 mas at 1.51 μm, 1.64 μm, and 1.78 μm, respectively) are marked with the dashed circle. The bright spots A, B, and C corresponding to H 2O maser features a, b, and c obtained by Vlemmings et al. (2005) are marked. The synthesized beams of the interferometer for all wavelengths are shown on the bottom.
Other Images in This Article
Copyright and Terms & Conditions
© 2009. The American Astronomical Society. All rights reserved.