Image Details
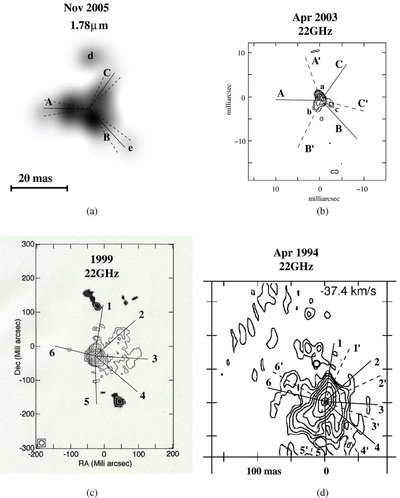
Caption: Figure 5.
Comparison of the 1.78 μm IOTA image (a) with 22 GHz water maser map (b) obtained in 2003 Vlemmings et al. (2005), 22 GHz water maser maps (c) obtained in 1999 Murakawa et al. (2002) and the map (d) from 1994 Bains et al. (2003). Corresponding features in pair of images are marked with rays. The interval of position angles describing the position angle accuracy is marked in (a) with dashed lines. The position of the star on the Bains et al. (2003) map (d) is marked with a circle.
Other Images in This Article
Copyright and Terms & Conditions
© 2009. The American Astronomical Society. All rights reserved.
Copyright ©
2025 Astronomy Image Explorer. All Rights Reserved.