Image Details
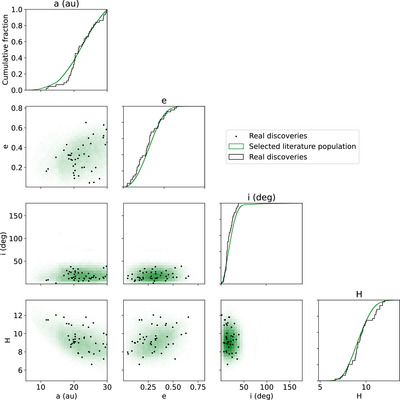
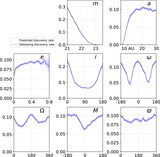
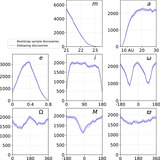
Caption: Figure 6.
Discovered objects (black) scattered over a heat map of the selected literature population in each pair of {a, e, i, H}. Plots on the diagonal show the marginal cumulative distribution functions across each dimension. Visually, the populations appear to be in agreement, though the dearth of discovered objects around a ∼ 17, H ∼ 10.5, and of objects with both low a and low H are each noteworthy.
Other Images in This Article

Copyright and Terms & Conditions
© 2025. The Author(s). Published by the American Astronomical Society.
Copyright ©
2025 Astronomy Image Explorer. All Rights Reserved.