Image Details
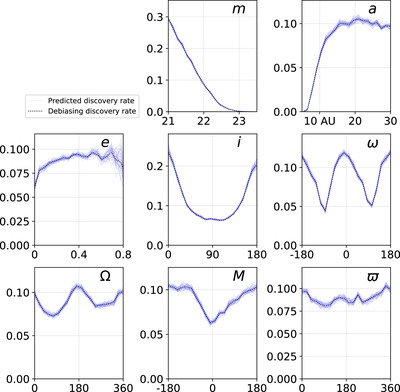
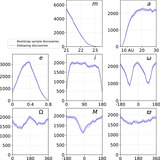
Caption: Figure 4.
The selection function marginalized across each dimension. Dotted black lines show the fraction of debiasing objects discovered. Purple lines represent 40 bootstrapped samples of the debiasing population, shown to demonstrate an uncertainty region. Detection probability is strongly dependent on apparent magnitude (m), semimajor axis (a), and inclination (i), but only moderately dependent on other parameters, and nearly uniform with respect to longitude of perihelion (ϖ). Note how the discovery probability at high m converges to zero, but the convergence to a maximum at low m is not captured. The uncertainty region grows where we included few debiasing objects, such as at high e and low and high i.
Other Images in This Article

Copyright and Terms & Conditions
© 2025. The Author(s). Published by the American Astronomical Society.