Image Details
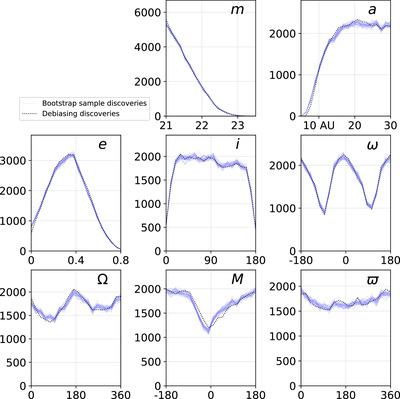
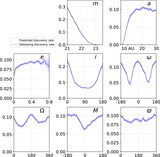
Caption: Figure 5.
We perform leave-one-out cross-validation of our model, applying the selection function to 40 bootstrapped samples of the debiasing population. We avoid representing objects as themselves (which would guarantee perfect predictions) by using each object's second-nearest neighbor to predict its detection or nondetection. Overall, the model recreates the marginal distributions well. Deviations between the purple cross-validation region and the true discoveries reveal model bias and shortcomings. In particular, the model is fairly inaccurate in predicting discoveries as a function of M. Near the low boundary of a and e, the predictions are biased upwards, toward the bulk of the population. Other inconsistent regions include the peaks of m and a and the troughs of Ω.
Other Images in This Article

Copyright and Terms & Conditions
© 2025. The Author(s). Published by the American Astronomical Society.