Image Details
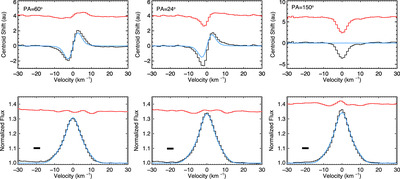
Caption: Figure 6.
Comparison of AB Aur observed at three different slit PAs. The data are plotted with black lines, the model is blue and the residual is plotted above in red. The horizontal lines in the lower panels indicate the instrumental resolution of the observation. The model used to fit the profile and SA signal for the slit aligned with the semimajor axis of the disk (PA = 60°) was applied for two other PAs. While the profile could be fit reasonably well, the SA signal diverged significantly from the model. One way to account for this is for a nonaxisymmetric source of emission on the southern part of the disk.
Other Images in This Article

Copyright and Terms & Conditions
© 2024. The Author(s). Published by the American Astronomical Society.