Image Details
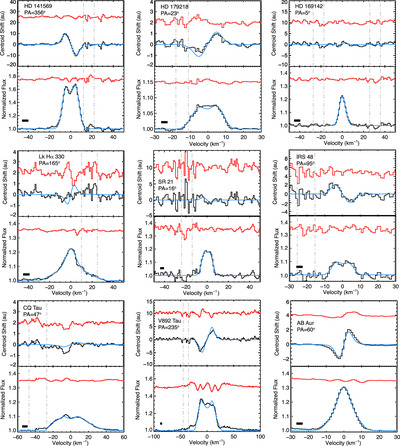
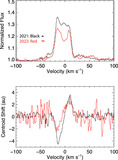
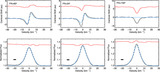
Caption: Figure 1.
Modeled line profiles and SA signals for the sample. The SA signal and average line profile are plotted for each target (black lines in the upper and lower panels, respectively). The PA of the slit is indicated for the observation presented in the figure. The horizontal black bars indicate the instrumental resolution of the observation. The best-fit models are plotted in blue, and the residuals between the data and the fits are plotted above in red. The Doppler shift has been corrected for Earth’s motion and the radial velocity of the star using the values presented in Table 2. For the targets with multiple observations or epochs, those shown here are as follows: HD 169142 is averaged between 2017 April 20 and August 25; CQ Tau is from 2023 January 21; V892 Tau is from 2021 January 16; and AB Aur is from 2021 February 6. The velocity range affected by telluric correction of the low-J CO lines is indicated with vertical gray lines. For HD 169142, the data from two nights separated by 4 months were combined so two velocity ranges are indicated. The range containing telluric absorption for AB Aur falls outside of the plotted velocity range. The SA data provide a measure of the shift of the PSF (emission line and continuum) and should not be confused with the maximum spatial offset of the emission line.
Other Images in This Article
Copyright and Terms & Conditions
© 2024. The Author(s). Published by the American Astronomical Society.