Image Details
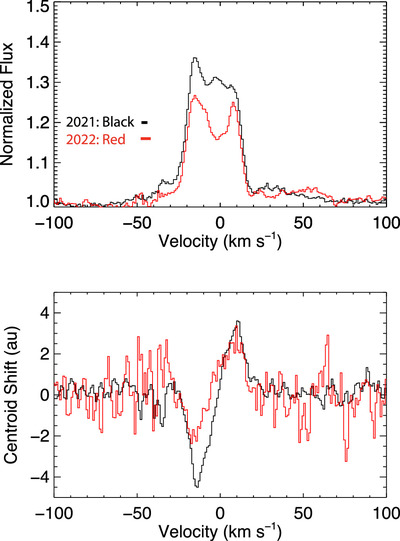
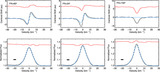
Caption: Figure 5.
Comparison of 2021 (black) and 2022 (red) average spectroscopic and SA profiles of V892 Tau. The horizontal bars indicate the instrumental resolution of each observation. The PA is offset by 35° between epochs. While the line profile is asymmetric in both epochs, the overall spectroscopic profile changed to exhibit a double-peaked structure, though still with an excess on the blue side. The SA signal is extended on the red and blue sides of the line, consistent with emission arising from an extended disk.
Other Images in This Article

Copyright and Terms & Conditions
© 2024. The Author(s). Published by the American Astronomical Society.
Copyright ©
2025 Astronomy Image Explorer. All Rights Reserved.