Image Details
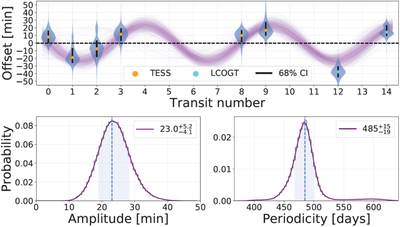
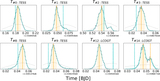
Caption: Figure 7.
Top: midpoint timing distributions from Figure 6 plotted across time. The width of the blue region indicates the posterior probability distribution. The purple curves show sinusoid fits to 1000 random draws of these distributions. The timings display a sinusoidal variation suggestive of systematic TTVs. Bottom: distributions of the amplitude and periodicity from fitting 105 random draws. A zero-amplitude line (i.e., fixed-period ephemeris) is disfavored at 5.7σ.
Other Images in This Article

Copyright and Terms & Conditions
© 2023. The Author(s). Published by the American Astronomical Society.
Copyright ©
2025 Astronomy Image Explorer. All Rights Reserved.