Image Details
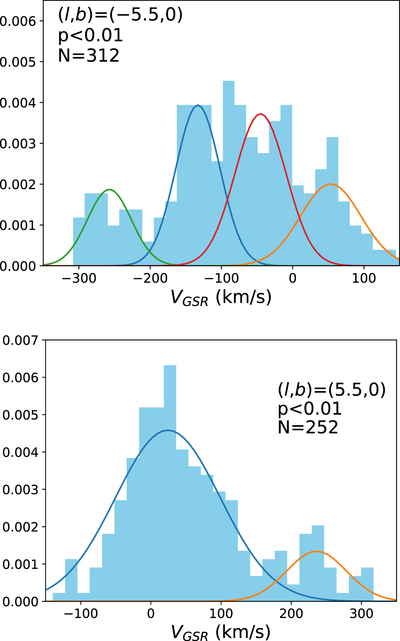
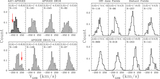
Caption: Figure 7.
A histogram of the Galactocentric velocities of APOGEE stars at (l,b) = (5.°5,0°) (bottom) and the APOGEE+AAT stars at (l,b) = (−5.°5,0°) (top). The best-fit curve to the histogram from a k-means clustering algorithm and a GMM is overlaid. The mean and standard deviations of these distributions are given in Table 3.
Other Images in This Article

Copyright and Terms & Conditions
© 2021. The American Astronomical Society. All rights reserved.
Copyright ©
2025 Astronomy Image Explorer. All Rights Reserved.