Image Details
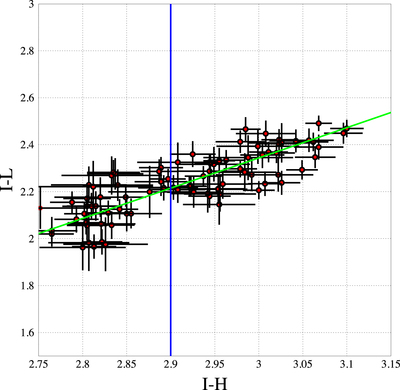
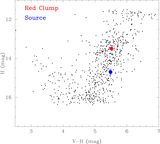
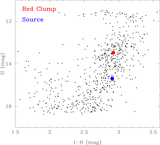
Caption: Figure 7.
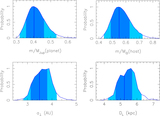
IHL color–color diagram for field stars in the neighborhood of the clump, ﹩(2.75\lt (I-H)\lt 3.10)\times (16\lt I\lt 17.6)﹩. The diagonal line is a fit to the points. The vertical line is the observed color of the source. The inferred color (y-axis) of the source, ﹩{(I-L)}_{s}=2.215\pm 0.015﹩, is used as a constraint when incorporating the Spitzer data into the fit.
Other Images in This Article

Show More
Copyright and Terms & Conditions
© 2020. The American Astronomical Society. All rights reserved.
Copyright ©
2025 Astronomy Image Explorer. All Rights Reserved.