Image Details
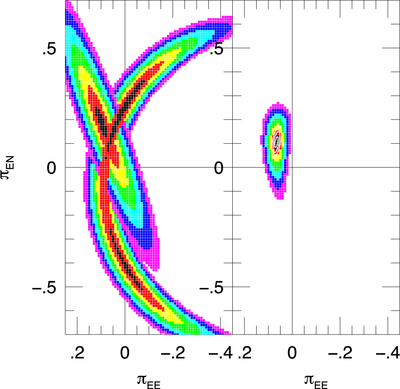
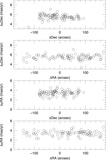
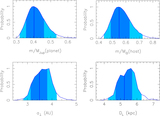
Caption: Figure 2.
OGLE-2017-BLG-0406 parallax contours for the W+ solution. Left: the ground-only (elliptical) contours are derived from the covariance matrix from the MCMC, while the Spitzer-“only” (arc-like) contours are derived from the analytical expression in Equation (7). The colors (black, red, yellow, green, cyan, blue, magenta) represent ﹩{\rm{\Delta }}{\chi }^{2}\lt (1,4,9,16,25,36,49)﹩. Note that the 1σ contours for the ground-only and Spitzer-“only” measurements overlap. Right: Colored contours are the ﹩{\rm{\Delta }}{\chi }^{2}﹩ values for the sum of the two ﹩{\chi }^{2}﹩ distributions that are shown to the left. Despite the fact the each set of contours on the left provides essentially 1D information, the combination is well constrained in both dimensions. The white ellipses represent the 1σ, 2σ, and 3σ contours from the combined numerical fit to all of the data. The semi-analytic approach (colored contours) provides a very good, although not perfect, representation of the full numerical result. This shows that the semi-analytic approach enables one to accurately trace the information flow.
Other Images in This Article

Show More
Copyright and Terms & Conditions
© 2020. The American Astronomical Society. All rights reserved.