Image Details
Caption: Figure 1.
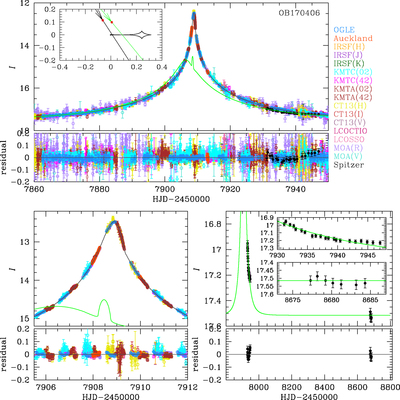
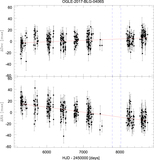
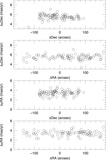
Observed light curve of OGLE-2017-BLG-0406 and best-fit model light curve for the Wide (+,+) model. Data points from different collaborations are shown with different colors. The blue and green solid lines are the model light curves for the ground and Spitzer observations. The bottom left and right panels show a close-up of the anomaly and Spitzer observations with the residuals from the best-fit model, respectively. The insert on the top panel shows the caustic structure.
(The data used to create this figure are available.)
Other Images in This Article

Show More
Copyright and Terms & Conditions
© 2020. The American Astronomical Society. All rights reserved.
Copyright ©
2025 Astronomy Image Explorer. All Rights Reserved.