Image Details
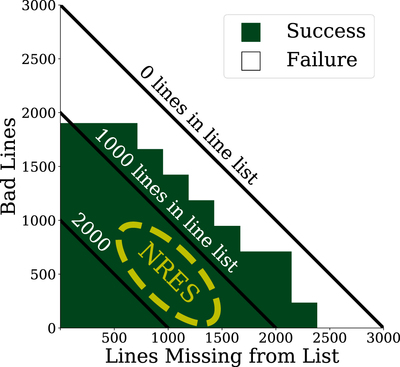
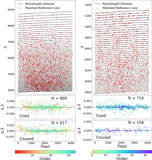
Caption: Figure 7.
Synthetic spectra where our algorithm succeeds (in green) and fails (in white). Each spectrum contains 3000 features, and the reference list fed to our algorithm contains a subset of those features and contamination. We have labeled contours where the reference wavelength lists are of equal length. The region above the solid black line is where the reference wavelength list known to the algorithm is empty. The region within the dashed ellipse is our estimate for the demographics for NRES emission features on a typical calibration exposure (Appendix C).
Other Images in This Article


Copyright and Terms & Conditions
© 2020. The American Astronomical Society. All rights reserved.
Copyright ©
2025 Astronomy Image Explorer. All Rights Reserved.