Image Details
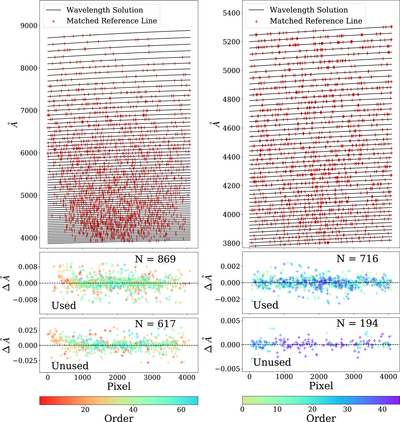
Caption: Figure 5.
Left: NRES residuals from the Sutherland, South Africa, NRES unit. Right: HARPS residuals from calibrating only the bluemost 45 diffraction orders (orders 116–161). The top panels show the wavelength solutions evaluated at every pixel and order as black lines. The uppermost line is the redmost order and the bottommost line is the bluemost order. Each red hatch mark gives the pixel position of an emission line and the wavelength of its closest match in the reference wavelength list (the ESO ThAr atlas here). Middle panel: the residuals between the ThAr lines which constrained the wavelength solution and their closest matches in the reference list, color coded by diffraction order. Bottom panels: the low signal-to-noise lines which we did not use to constrain the wavelength solution (our validation set).
Other Images in This Article


Copyright and Terms & Conditions
© 2020. The American Astronomical Society. All rights reserved.