Image Details
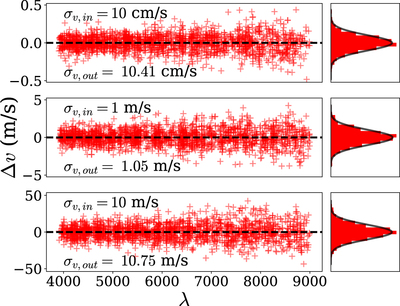
Caption: Figure 6.
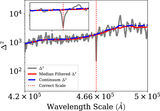
The velocity-equivalent residuals from wavelength -calibrating synthetic data which are modeled after NRES, for three levels of velocity-equivalent Gaussian centroid errors (﹩{\sigma }_{v,\mathrm{in}}﹩): 10 cm s−1, 1 m s−1 and 10 m s−1. In each panel, the injected error ﹩{\sigma }_{v,\mathrm{in}}﹩ is shown near the top left, and the error estimated from the residuals after calibrating the spectrum, ﹩{\sigma }_{v,\mathrm{out}}﹩, is shown below it. To the right of each panel, we have plotted a Gaussian with zero mean and standard deviation ﹩{\sigma }_{v,\mathrm{in}}﹩ on top of the histogram of residuals.
Other Images in This Article

Copyright and Terms & Conditions
© 2020. The American Astronomical Society. All rights reserved.
Copyright ©
2025 Astronomy Image Explorer. All Rights Reserved.