Image Details
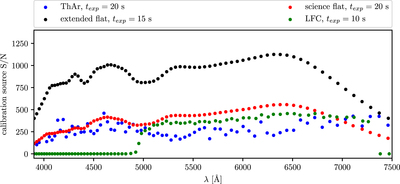
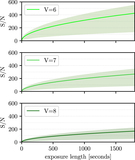
Caption: Figure 8.
The S/N per pixel in each order for each of the calibration sources, including the extended flat. The length of the exposures is noted in the legend. The peak S/N per pixel in each order is shown for the LFC and flat-field light source, while the mean line S/N per pixel for lines above an S/N of 100 in each order is shown for the ThAr lamp.
Other Images in This Article


Show More
Copyright and Terms & Conditions
© 2020. The American Astronomical Society. All rights reserved.
Copyright ©
2025 Astronomy Image Explorer. All Rights Reserved.