Image Details
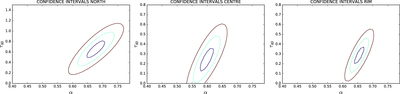
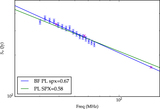
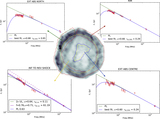
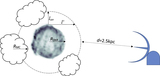
Caption: Figure 7.
Contour plots for the three regions showing external absorption in Figure 6: north (shown in red over Tycho in Figure 6), center (in blue), and rim (in red). Plotted are the 1σ, 2σ, and 3σ confidence intervals for the parameters α and τ40,ext for each of the regions. Only for one region, center, τ40,ext = 0 (no absorption) is not excluded at the 3σ. For the two other regions, in particular for the northern region that we base our analysis on, we require the presence of absorption along the line of sight at the 3σ level.
Other Images in This Article
Copyright and Terms & Conditions
© 2019. The American Astronomical Society. All rights reserved.
Copyright ©
2026 Astronomy Image Explorer. All Rights Reserved.