Image Details
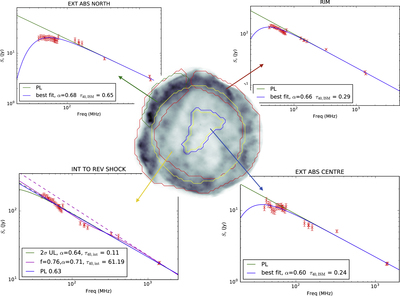
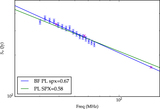
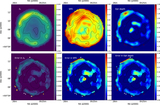
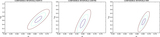
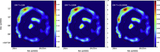
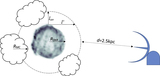
Caption: Figure 6.
HBA map with overlaid regions of analysis. The values of f, τ40, and α are unitless. For all regions, the errors were rescaled in such a way that the best-fit power law has a reduced χ2 of 1. The top plots and the bottom right plot (corresponding to the green, red, and blue regions as overlaid on Tycho) are fitted including external absorption (in blue, the best-fit unabsorbed power law is in green), and in all cases including the absorption term improves the fit: with a Δχ2 = 16 for “EXT ABS NORTH”, a Δχ2 = 4 for “EXT ABS CENTRE”, and a Δχ2 = 10.5 for “RIM” (in all cases, for an additional degree of freedom). The bottom left plot corresponds to the region of possible internal absorption. The mask of the reverse shock radius is plotted in yellow over the map of Tycho. In the legends, “UL” stands for upper limit and “PL” stands for power law.
Other Images in This Article
Copyright and Terms & Conditions
© 2019. The American Astronomical Society. All rights reserved.