Image Details
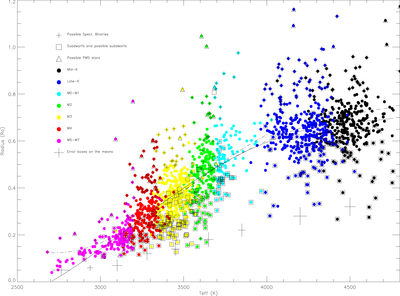
Caption: Figure 4.
Stellar radius as a function of Teff for our samples of K and M dwarfs. We show the heteroscedastic least-squares fit as the continuous line. The dashed line shows the fit from Boyajian et al. (2012). The dotted–dashed line represents the fit determined by Mann et al. (2015) for their sample of stars. The large scatter present in this figure is due (in large part) to the effects of different values of metallicity among the individual stars in any sample.
Other Images in This Article
Copyright and Terms & Conditions
© 2019. The American Astronomical Society. All rights reserved.
Copyright ©
2025 Astronomy Image Explorer. All Rights Reserved.