Image Details
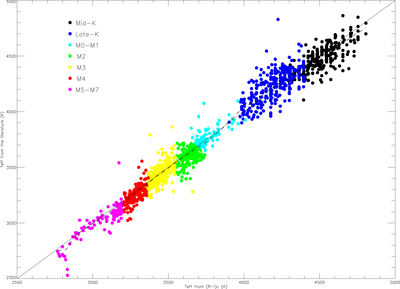
Caption: Figure 2.
Comparison between two sets of values of Teff: (i) taken from the literature and (ii) derived from the (R – I)C/Teff correlations that have been derived by M15 and B12. Continuous line: the correlation that would exist if there was an exact one-to-one correspondence between the two sets of Teff. Dashed line: the best-fit correlation when the data are smoothed by a Gaussian of FWHM 30 K. Note that there exists a good overall agreement between the smoothed data and the expectations of a one-to-one correspondence.
Other Images in This Article
Copyright and Terms & Conditions
© 2019. The American Astronomical Society. All rights reserved.
Copyright ©
2025 Astronomy Image Explorer. All Rights Reserved.