Image Details
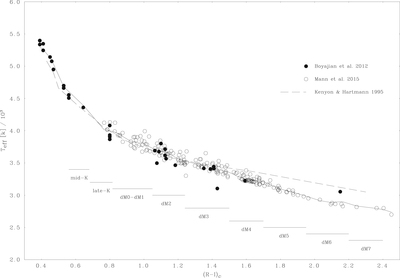
Caption: Figure 1.
Values of Teff as a function of the (R – I)c color for the data of B12 (filled circles) and M15 (open circles) and a smoothing of these data (solid line). Also shown for comparison: the calibration of Kenyon & Hartmann (1995). This later calibration agrees well with the more recent measures of Mann et al. (2015) up to (R – I)c = 1.3, but tends to overestimate Teff for later spectral types. We overplot the (R – I)c domains of our samples of stars from mid-K to dM7.
Other Images in This Article
Copyright and Terms & Conditions
© 2019. The American Astronomical Society. All rights reserved.
Copyright ©
2025 Astronomy Image Explorer. All Rights Reserved.