Image Details
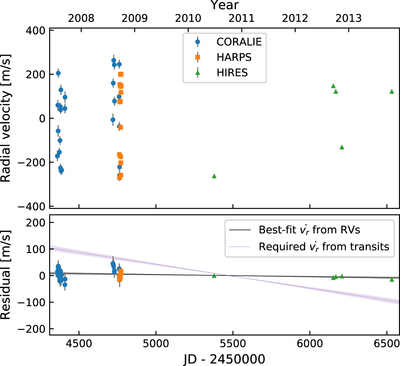
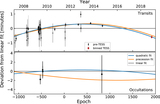
Caption: Figure 6.
Radial velocities of WASP-4 (top), and residuals from the best-fit Keplerian model (bottom). The lower panel shows the best-fit linear trend inferred from the RV data (black line, 1σ errors in gray), and the trend that would be needed to produce the period decrease seen in transits (purple dotted line). Since both the RV and transit timing data sets are sparse after 2013, a distant, massive companion on an eccentric orbit might still explain the observations.
Other Images in This Article
Copyright and Terms & Conditions
© 2019. The American Astronomical Society. All rights reserved.
Copyright ©
2025 Astronomy Image Explorer. All Rights Reserved.