Image Details
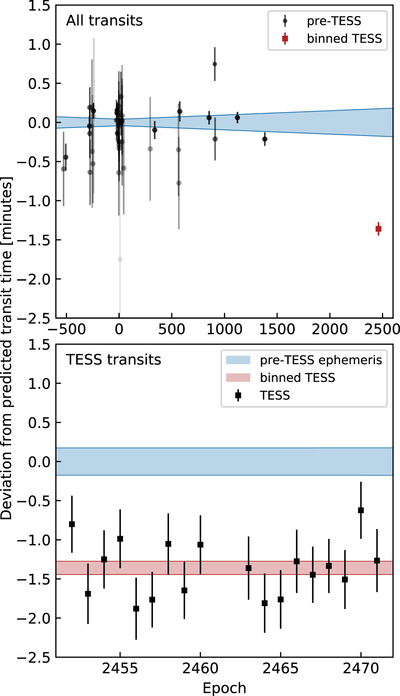
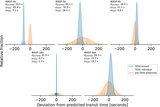
Caption: Figure 3.
TESS saw WASP-4b transit earlier than expected. Both plots show the deviations between observed and calculated transit times, where the calculation is based only on pre-TESS data and assumes a constant period. The blue bands depict the ±1σ credible interval of the predicted times. Top: The full timing data set spans 11 yr. The darkest points correspond to the most precise data. The binned TESS point is the weighted average of 18 TESS transits. Bottom: close-up of the TESS observations. The red band shows the average deviation of the TESS transits (±1σ), which arrived ﹩81.6\pm 11.7\ {\rm{s}}﹩ earlier than predicted.
Other Images in This Article
Copyright and Terms & Conditions
© 2019. The American Astronomical Society. All rights reserved.