Image Details
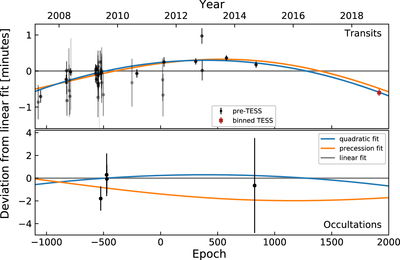
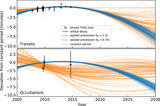
Caption: Figure 4.
Timing residuals and best-fit models for WASP-4b. The vertical axis shows the observed times minus the calculated times assuming a constant period for transits (top) and occultations (bottom). In the upper panel, darker points correspond to more precise data. The constant-period model (gray line) is a poor description of the data. Models with a decreasing period (blue) or an eccentric, precessing orbit (orange) provide better fits. The binned TESS point (red square) is the weighted average of 18 TESS transits and is for display purposes only. The models were fitted to all of the individual transit times.
Other Images in This Article
Copyright and Terms & Conditions
© 2019. The American Astronomical Society. All rights reserved.
Copyright ©
2025 Astronomy Image Explorer. All Rights Reserved.