Image Details
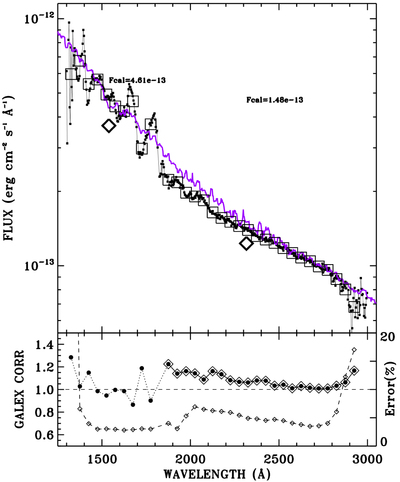
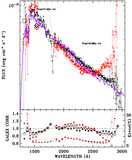
Caption: Figure 6.
IUE spectrum of GD108 (purple) overplotted with GALEX spectra as small squares and as large squares in 50 Å bins, as in Figure 5. The mean FUV IUE flux at 1539 Å is Fcal = 4.61e−13, which is slightly above the adopted limit of 4.5e−13 for good GALEX spectra. In the lower panel, the ratio of IUE/GALEX fluxes is shown as black circles and diamonds connected by solid lines, while the GALEX plus IUE statistical uncertainties combined in quadrature appear as small black diamonds connected by dashed lines with a scale in percent indicated on the right axis.
Other Images in This Article
Copyright and Terms & Conditions
© 2019. The American Astronomical Society. All rights reserved.
Copyright ©
2026 Astronomy Image Explorer. All Rights Reserved.