Image Details
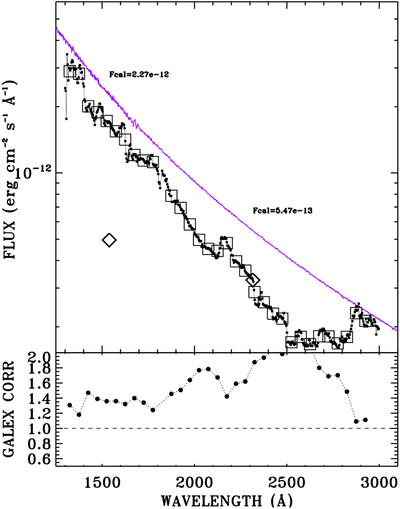
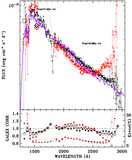
Caption: Figure 2.
CALSPEC spectrum of HZ43 (purple) overplotted with the GALEX spectrum as small black squares and as large black squares in 50 Å bins, as in Figure 1. The flux values of the CALSPEC SED at the 1539 and 2316 Å reference wavelengths are written on the plot. Both the GALEX photometry and spectral fluxes are low, as expected when the GALEX detector approaches saturation. In the lower panel, there are no little or big black diamonds that indicate useful measures of the CALSPEC/GALEX flux ratio.
Other Images in This Article
Copyright and Terms & Conditions
© 2019. The American Astronomical Society. All rights reserved.
Copyright ©
2024 Astronomy Image Explorer. All Rights Reserved.