Image Details

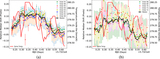
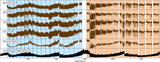
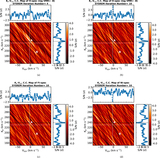
Caption: Figure 13.
Order-based optimized version of the cross-correlation map for H-spec with log VMR = −8 (first row), FI-spec (second row), NI-spec (third row), and the injected signal (fourth row). The left panel shows the mean CCF map. The middle panel shows the aligned mean CCF map at Kp = +237.5 km s−1 and Vsys = −1.5 km s−1. The planet signal can be seen as a dark trail in the expected rest frame of the radial velocity of the planet from the first observed phase until the appearance of the secondary eclipse phase (red dashed). The right panel shows the mean CCF for a six-pixel column bin (CCFexo) centered on Vsys = −1.5 km s−1 along the orbital phase. The solid black line shows the smoothed CCFexo with a three-frame smoothing window. The blue dashed line shows the zero value of the CCF.
Other Images in This Article
Show More
Copyright and Terms & Conditions
© 2017. The American Astronomical Society. All rights reserved.