Image Details
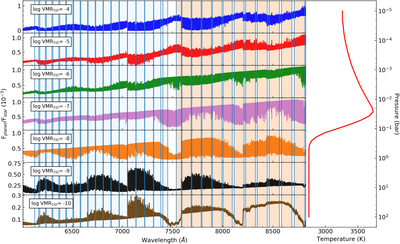
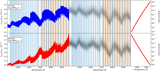
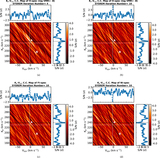
Caption: Figure 5.
WASP-33b spectrum model using the T/P profile of Haynes et al. (2015). The left panel shows the WASP-33b model spectrum with various VMRs. The vertical axis shows the planet to star flux contrast in the level of 10−3. The right panel shows our adopted temperature profile for the WASP-33b atmosphere.
Other Images in This Article
Show More
Copyright and Terms & Conditions
© 2017. The American Astronomical Society. All rights reserved.
Copyright ©
2024 Astronomy Image Explorer. All Rights Reserved.